-Credit: Ririnama R.
1. Bikin line, inget 0 derajat kalau di kuardan lingkaran.Garisnya gak usah nanggung, yang panjang, sampai ketemu pulau, kalau lebih dari 200 km panjang garisnya, minimal lu bikin dulu aja line nya panjangnya 200 km. or lebihin dikit gpp, tar kan dipotong pake trim
2. bikin lingkaran (perintahnya circle), jari-jarinya 200 km
3. Garisnya bikin sebanyak 72.(kalau gak salah polar_array), nah kalau udah sebanyak ini potong-potong, biar enak ngelihatnya. pake trim.
4. ada kemungkinan gejala, garisnya yg 72, ngeblok, nyambung semua, bikin lu susah motong/ngetrim, lalu dilepas bloknya pake perintah explode.
5. nah kalau udah gini jadi gampang motong (trim) nya, kalau untuk kebutuhan display yang cantik, usahakan garisnya sampai ketemu pulau, atau garis pantai, ketik trim enter, terus pilih garis pantai yang jadi batasnya, lalu tekan enter, lalu potong fetchnya, tekan enter lagi. Untuk kebutuhan perhitungan beda lagi, trimnya, yang dijadiin batas yg lingkarannya, langkahnya sama. karena max fetch dianggap 200 km. ohiya ada satu lagi pastiin mapnya bener dan untuk kebutuhan display yang bagus pilih mapnya yang bagus bisa google earth, nanti fetchnya diexport ke google earth, biar lebih bagus lagi per sembilan garis kasih warna (per arah mata angin), jadi setidaknya untuk sistem 8 arah mata angin lu punya 8 warna garis fetch yg beda-beda. guwa lihat yg lain ada yg pake 16 mata angin, tapi da beti lah. silahkan dicoba.
Monday, October 23, 2017
Friday, January 15, 2016
Calculation of Vertical Wall Breakwaters using Goda formulation (1984)
Hi there!
a few months ago I got an assignment from my boss to calculate the wave force infront of a vertical wall breakwater using Goda formulation. i found it quite 'a work' if you have to calculate it one by one using a calculator so that i'm (again) doing it using matlab as always, the case that i use is taken from problem example in the book itself (Example 4.1 Goda, 1984). here it is:

clc; clear all; close all;
% Wave force calculation according to GODA, 1985
% mei.ramdhani@gmail.com
%% UPDATE
% 27/10/15 : Iteration for calculating alfa 1 and 1/cosh(2*pi()*h/L) added
% tobe Updated
% 25/10/15 : tobe added --> Newton rapshon iteration for calculation L0
%% INPUT
% depth definition
h01= 9.5; %from SWL to the seabed
h02= 6.5; %from SWL to the end of the vertical wall or h'
h03= 5 ; %from SWL to the bagian kaki dari vertical wall atau d
h04= 4; %from crest of BW to the SWL or hc
% Waves
H_0 =6.3; %[m] Significant wave height in offshore (H'0)
Tsig =11.4; %[s] Significant wave period in offshore (T1/3)
beta =15; %[deg] angle between the direction of wave approach and a line normal to BW
% Tide Level
LWL=0 ; % [m] Lowest water level
HWL=0.6; % [m] Highest water level
MSL=0.3; % [m] Mean sea level
% Sea Bottom Slope
tan_teta=1/100;
%Width of The bottom of the upright section
B=15 ; %[m]
H1_3 =5.8 ; % H1/3 taken from mike SW
Hmax =8 ; % eq. 3.26 (Goda, 1984) or from wave model simulation
%% LOADING GODA CURVE
g10=load('goda10.dat'); % calculation diagram for parameter alpha1 (Goda, 1984)
g11=load('goda11.dat');
g20=load('goda20.dat');
g21=load('goda21.dat');
%% WATER DEPTH AND CREST ELEVATION
h = h01+HWL; %[m] h
h1= h02+HWL; %[m] h'
d = h03+HWL; %[m] d
hc= h04-HWL; %[m] hcrest
%% CALCULATION OF WAVE LENGTH AND WAVE HEIGHT
L0 =202.7 % [m] calculated using newton rapshon (later)
H1L1 =H_0/L0 ; %H'0/L0
hL0 =h/L0 ; %h/L0
hb =h+(h03*H1_3/100);
%% COEFICIENT FOR WAVE PRESSURE
the coefficient of alpha 1 is taken from this curve:

Digitzed the diagram save it to g10 and g11 file..
%alfa1
temp1=h/L0;
if temp1 <= 0.1, alfa1 = polyval(g10,temp1),...
else,alfa1 = polyval(g11,temp1);...
end;
%alfa2
tema1=((hb-d)/(3*hb)*(Hmax/d)^2);
tema2=((2*d)/Hmax);
alfa2=min([tema1,tema2]);
and so does for the par1 parameter, i get it from this curve

if temp1 <= 0.15, par1= polyval(g20,temp1),...
else,par1 = polyval(g21,temp1);...
end;
alfa3=(1)-(7.1/10.1)*(1-par1)
%% MAXIMUM ELEVATION OF THE WAVE PRESSURE
cosb=cos(beta*pi/180);
etas=0.75*(1+cosb)*Hmax;
%% PRESSURE COMPONENT
w0=1.03 %[ton/m3] spesific wight of sea water
p1=(1/2)*(1+cosb)*(alfa1+(alfa2*(cosb)^2))*(w0)*(Hmax); %[ton/m2]
p2=p1/(1/par1)
p3=alfa3*p1; %[ton/m2]
if etas > hc,...
p4=p1*(1-(hc/etas)),... %[ton/m2]
else,...
p4=0 %[ton/m2]
end
% toe pressure
pu=(1/2)*(1+cosb)*alfa1*alfa3*w0*Hmax %[ton/m2]
%% TOTAL PRESSURE AND UPLIFT
hcs=min(etas,hc) %[m] this is hc*
% Total Wave Pressure
P=(0.5*(p1+p3)*(h1))+(0.5*(p1+p4)*hcs) %[ton/m]
% Total Uplift Pressure
U=0.5*(pu)*B %[ton/m3]
%% MOMENT OF WAVE PRESSURE
MP=((1/6)*(2*p1+p3)*(h1^2))+(0.5*(p1+p4)*h1*hcs)+((1/6)*(p1+2*p4)*hcs^2) %[ton-m/m]
%% MOMENT OF UPLIFT PRESSURE
MU=(2/3)*U*B
Reference:
Goda (1984), Random Seas and Design of Maritime Structures, University of Tokyo Press
a few months ago I got an assignment from my boss to calculate the wave force infront of a vertical wall breakwater using Goda formulation. i found it quite 'a work' if you have to calculate it one by one using a calculator so that i'm (again) doing it using matlab as always, the case that i use is taken from problem example in the book itself (Example 4.1 Goda, 1984). here it is:
Calculate the wave pressure, uplift pressure, and their
moment produced by wave of the following characteristicsincident on the upright
section of the vertical wall breakwater shown in Fig below:

Wave : H’0 = 6.3 [m] , T1/3= 11.4 [s] , b=15
[deg]
Tide level : W.L = + 0.6 [m]
Sea bottom slope tanθ = 1/100
And this is my matlab script to calculate the : wave pressure, uplift pressure and their moments
% Wave force calculation according to GODA, 1985
% mei.ramdhani@gmail.com
%% UPDATE
% 27/10/15 : Iteration for calculating alfa 1 and 1/cosh(2*pi()*h/L) added
% tobe Updated
% 25/10/15 : tobe added --> Newton rapshon iteration for calculation L0
%% INPUT
% depth definition
h01= 9.5; %from SWL to the seabed
h02= 6.5; %from SWL to the end of the vertical wall or h'
h03= 5 ; %from SWL to the bagian kaki dari vertical wall atau d
h04= 4; %from crest of BW to the SWL or hc
% Waves
H_0 =6.3; %[m] Significant wave height in offshore (H'0)
Tsig =11.4; %[s] Significant wave period in offshore (T1/3)
beta =15; %[deg] angle between the direction of wave approach and a line normal to BW
% Tide Level
LWL=0 ; % [m] Lowest water level
HWL=0.6; % [m] Highest water level
MSL=0.3; % [m] Mean sea level
% Sea Bottom Slope
tan_teta=1/100;
%Width of The bottom of the upright section
B=15 ; %[m]
H1_3 =5.8 ; % H1/3 taken from mike SW
Hmax =8 ; % eq. 3.26 (Goda, 1984) or from wave model simulation
%% LOADING GODA CURVE
g10=load('goda10.dat'); % calculation diagram for parameter alpha1 (Goda, 1984)
g11=load('goda11.dat');
g20=load('goda20.dat');
g21=load('goda21.dat');
%% WATER DEPTH AND CREST ELEVATION
h = h01+HWL; %[m] h
h1= h02+HWL; %[m] h'
d = h03+HWL; %[m] d
hc= h04-HWL; %[m] hcrest
%% CALCULATION OF WAVE LENGTH AND WAVE HEIGHT
L0 =202.7 % [m] calculated using newton rapshon (later)
H1L1 =H_0/L0 ; %H'0/L0
hL0 =h/L0 ; %h/L0
hb =h+(h03*H1_3/100);
%% COEFICIENT FOR WAVE PRESSURE
the coefficient of alpha 1 is taken from this curve:

Calculation diagram for alpha 1
%alfa1
temp1=h/L0;
if temp1 <= 0.1, alfa1 = polyval(g10,temp1),...
else,alfa1 = polyval(g11,temp1);...
end;
%alfa2
tema1=((hb-d)/(3*hb)*(Hmax/d)^2);
tema2=((2*d)/Hmax);
alfa2=min([tema1,tema2]);
and so does for the par1 parameter, i get it from this curve

Calculation diagram for the factor of 1/cosh(2*pi*h/L)
if temp1 <= 0.15, par1= polyval(g20,temp1),...
else,par1 = polyval(g21,temp1);...
end;
alfa3=(1)-(7.1/10.1)*(1-par1)
%% MAXIMUM ELEVATION OF THE WAVE PRESSURE
cosb=cos(beta*pi/180);
etas=0.75*(1+cosb)*Hmax;
%% PRESSURE COMPONENT
w0=1.03 %[ton/m3] spesific wight of sea water
p1=(1/2)*(1+cosb)*(alfa1+(alfa2*(cosb)^2))*(w0)*(Hmax); %[ton/m2]
p2=p1/(1/par1)
p3=alfa3*p1; %[ton/m2]
if etas > hc,...
p4=p1*(1-(hc/etas)),... %[ton/m2]
else,...
p4=0 %[ton/m2]
end
% toe pressure
pu=(1/2)*(1+cosb)*alfa1*alfa3*w0*Hmax %[ton/m2]
%% TOTAL PRESSURE AND UPLIFT
hcs=min(etas,hc) %[m] this is hc*
% Total Wave Pressure
P=(0.5*(p1+p3)*(h1))+(0.5*(p1+p4)*hcs) %[ton/m]
% Total Uplift Pressure
U=0.5*(pu)*B %[ton/m3]
%% MOMENT OF WAVE PRESSURE
MP=((1/6)*(2*p1+p3)*(h1^2))+(0.5*(p1+p4)*h1*hcs)+((1/6)*(p1+2*p4)*hcs^2) %[ton-m/m]
%% MOMENT OF UPLIFT PRESSURE
MU=(2/3)*U*B
Reference:
Goda (1984), Random Seas and Design of Maritime Structures, University of Tokyo Press
Wednesday, September 30, 2015
Sea wave lengths calculation using Newton-Rapshon Iteration
I made this script to calculating wavelength from input wave period and water depth. using newton rapshon iteration. the equation is basically from the dispersion relation of linear wave theory.
soo check this awt!! I hope this would usefull :3
--------------------------------------------------------------------------------------------------
clc ; clear all ; close all;
% Calculating wave number using iteration method : newton raphson
% Meirita R. | mei.ramdhani@gmail.com
%INPUT
T = [10]; % s --> Wave Period
g = 9.8 ; % m/s --> Gravity constant.
h = 10 ; % m --> depth.
sigma2 = (2*pi()/T)^2 ; %--> agular frequency.
syms k ; %--> desired wave number.
% dispersive eq. based on linear wave theory
d=k*tanh(h*k)-(sigma2/g);
f=inline(d)
% derivatives of dispersive eq. based on linear wave theory
z=diff(d,k);
f1=inline(z)
% input initial value for k
x0=9;
x=x0;
% iteration process
for u=0:100
y=x;
x=y-[f(x)/f1(x)];
if x==y break
end
end
% WAVE NUMBER
wavenum =x
%WAVE LENGTH:
L(i)=(2*pi())/wavenum
-----------------------------------------------------------------------------------------------------
Wednesday, October 16, 2013
Things You Need To 'Messed-Up' the *.nc File data type
Dear myself,
Incase you forget (again) how to use the getnc.m fuction before you deal with wind data, or anykind of files with *.nc extention:
1. you these folders :
- matlab_netCDF_OPeNDAP
- netcdf_toolbox
- m_swan
you saved all these folders in your dropbox account on 'BERBAGAI_TOOLS_PENTING' or, in your PC at 'Perangkat Lembek'
2. set your matlab path like this:

3. Now your ready to rock!
Monday, March 5, 2012
Program Zero Up Crossing
Coming back to the blog and i got a good news for ya'll: I'm a master student now!! *YAY!* majoring Ocean Engineering in ITB. hahaha! I'm soo excited that finally i can sit in class again working on assignments and worrying the mid test :)) *Ewh~ such a beautiful pain!*
so today i'm going to post something, that related to my course in ITB. this is my first assignment in my master course: A Zero up crossing program in matlab! . for those who doesn't know what the f* is zero up crossing here's the definition :
zero up crossing is one common method that use to define one wave from wave records statistically. in this method a 'wave' is defined as the portion of a record between two successive zero up crossings.
still don't get it? here's the illustration taken from Mandly Hydraulics Laboratory:
 |
| zero up crossing wave illustration image taken from this |
so here's the program and the explaination:
1. Loading wave data from excell file:
clc;
clear all; close all;
%--------------------------------------------------
%
ZERO UP CROSSING PROGRAM
%
MEIRITA RAMDHANI
%
25511301
%
2ND ASSIGNMENT OF ADVANCE RANDOM WAVES SUBJECT
%
-------------------------------------------------
%
1. LOADING WAVE DATA
filename
='Wave elevation_wt_ meter_ Meulaboh_Feb4.xls';
sheet
= 'RawData Wave';
range
= 'D4:DP409';
PAR
= xlsread(filename, sheet, range);
dt=0.4;
2. Calculating wave average
%
2. CALCULATING WAVE AVERAGE
Araw=PAR(:,1);
Abar=sum(Araw)/length(Araw);
Azero=Araw-Abar;
resulting:
 |
| the wave data minus its average. |
3. Determining the zero up crossing index.
The zero up crossing index is determined by looking at the wave records value sign. after you subtracted your wave record with its average, you'll get your data reference in y=0. so that, you'll have data which values is negative and positive. from here, you can determine the zero up crossing index.
in your data, whenever negative values meets positive values then you'll get one zero up crossing wave. the 'one zero up crossing wave' is define between one 'negative-meet-positiv' and 'next negative-meet-positive'
*ewh.. i'm not really good in explaining this* anyway here's the matlab scipt:
%
3. CALCULATING ZERO UP CROSSING
I1=Azero(1:end-1);
I2=Azero(2:end);
indx=zeros(size(I1));
for
i=1:length(indx);
indx(i)=I1(i)*I2(i); %negativ
ketemu positiv
end
indz=find(indx
< 0); %index ZUC & ZDC
indc=zeros(length(indz),1);
indzuc=
find(Azero < 0);
zuc=intersect(indz,indzuc); %index zeroup
crossing
izuc=zeros(length(zuc),1);
result:
 |
| the wave data and it's zero up crossing index |
1. 4. Calculating the Wave height;
After you got your index, now, its time calculating the wave height between 2 index of zero up crossing that we define in previous. to calculate the wave height, we must subtracting the maximum and minimum values which happen in between 2 zero up crossing index. then you'll get list of wave height.
if you sort the wave height from the larger value to the smaller value then you can calculate other waves parameter such as: H1/3, H1/10, Hrms. etc.
%4.
CALCULATING WAVE HEIGHT
w1=zuc(1:end-1)+1;
w2=zuc(2:end);
for
i=1:length(w1);
A=max(max(Azero(w1(i):w2(i)))) %
maximum wave
B=min(min(Azero(w1(i):w2(i)))) %
minimum wave
H(i)=A-B
; % maximum wave height – minimum wave height
end
%5.
SORTING WAVE HEIGHT
nwave=length(H);
swave=sort(H)';
% mengurutkan tinggi gelombang dari yg tinggi ke rendah
swave=flipud(swave);
Results:
 |
| Upper picture is the wave height that is calculated from the zero up crossing . and the lower picture is after we sort the wave height. |
Oke that's it for today. hope the program will usefull for anyone who need it. next post will be arround FFT something.
SEE YA!
Wednesday, August 10, 2011
Menggabungkan data GEBCO dan batimetri lokal
Hal hal yang harus di perhatikan
- Pastikan kedua sumber data memiliki proyeksi dan georeference yang sama.
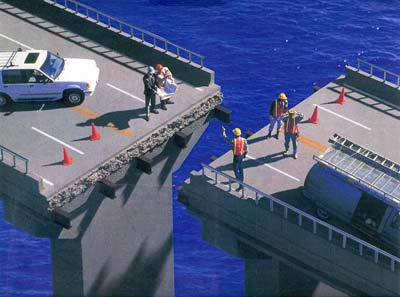
- Perhatikan definisi dari garis pantai, apakah garis pantai ditentukan dari LWL (Lowest Water Level) atau SWL (Surface Water Level) atau MSL (Mean sea level), kedua data yang hendak di gabung harus memiliki 2 definisi yang sama, kalo data dari GEBCO biasanya titik terendah diambil dari MSL. Kenapa sih referensi jadi penting? Sederhana saja, anda nggak mau kan kalo anda bangun jembatan ujungnya jadi kayak gini
 |
| kejadian ini bisa terjadi apabila petals yang dipakai georeferensinya tidak sama gambar dari sini |
Setelah semua data memiliki geo reference yang sama maka anda bisa menggabung
kedua data.
Dengan cara sbb:
Ekstrak data dari gebco dengan format X,Y,depth,
buang semua header, kecuali bagian Longitude Latitude Depth, edit kasih tanda
petik jadi “Longitude” “Latitude” “Depth”, perhatikan delimiter, pastikan
delimiter antara “Longitude” dan “Latitude”
dan “Depth” sama dengan delimiter data koordinat dibawahnya, save dalam bentuk .txt
Siapkan data dari peta local yang sudah didigitasi, beri header yang sama seperti data gebco diatas, lalu save dengan
nama yang berbeda dalam format *.txt
buka ArcGIS --> tools --> xydata
 |
| Dialog box yang muncul ketika xydata dipilih, sesuaikan sistem koordinat dengan tombol edit di kanan bawah |
Masukkan data GEBCO yang sudah
kita edit Specify X dan Y data sesuai dengan header yang sudah kita isi, lalu
edit coordinat system of input coordinatnya dengan tombol edit --> Select --> Geographic coordinate system
--> lalu pilih proyeksi
yang sesuai dengan input data kita misalnya world --> WGS 1984.prj .
 |
| tampilan arcgis ketika data gebco dan peta lokal sudah di masukan, data point berwarna ungu merupakan data GEBCO, sedangkan data yang membentuk garis pantai adalah point dari peta lokal yang sudah di digitasi |
Setelah semua proses di atas diselesaikanm maka
akan muncul file point di display (sebelah kiri) dengan ekstensi *.text events.
File dengan ekstensi seperti ini belum bisa di edit di ArcGIS, supaya bisa di
edit anda harus mengconvertnya menjadi bentuk shape file. Dengan cara di
eksport: klik kanan pada file point di display à
data à
eksport data save dalam bentuk *.shp Setelah itu bisa baru bisa di edit.
Setelah file di export, maka yang kita lakukan
selanjutnya adalah membuang data2 yang ‘overlap’ pada data GEBCO, caranya pada Editor --> start editing --> aktifkan editor lalu specify tasks nya : Modify Feature dan targetnya adalah
file GEBCO yang kita punya . lalu buang tiap poinnya sehingga distribusi data
menjadi seperti ini :
 |
| Data yang sudah di diubah dalam bentuk shapefile (*.shp) yang sudah dibuang |
Ketika data sudah di save , pada folder dimana
kita menyimpan workspace ArcGIS tadi, klik file *.dbf yang namanya sesuai yang file
*.shp yang di edit tadi di MS Excell. Copy, lalu gabungkan keduanya save dalam bentuk *.txt. Lalu griding kembali menggunakan surfer atau matlab. selesai
Tuesday, May 24, 2011
Dispersion relation something
meilalala: eh ka ane mu nanya dong inimah beneran lupa
d_kelik: Ya?
meilalala: definisi sifat dispersif gelombang itu apa ya?
meilalala: :D
d_kelik: Nanya apa?
meilalala: sifat dispersif gelombang dan gelombang yang dispersif itu apa ya? *beneran lupa ini* -.-"
d_kelik: Oo..tp km ngerti ga apa itu dispersive?
meilalala: sepertinya ngerti yang kayak gini bukan:
meilalala: pertama misalnya ada angin badai, membangkitkan gelombang
meilalala: ntar gelombang menjalar
meilalala: nah gelombang dengan frekuensi kecil akan jalan duluan
meilalala: diikutin dengan gelombang dengan frekuensi tinggi,
meilalala: nah terus apa ka? :D
meilalala: apa yang terjadi maksudnya?
d_kelik: Jd, gelombang itu bersifat dispersive, dr physics nya. Artinya, kecepatan gelombangnya itu bergantung dari wavelengthnya. Makin panjang gelombang,makin cepat laju propagasinya:baik phase maupun group velocity. Nah seperti apa relasinya, ini namanya relasi dispersi, yaitu relasi yg menghubungkan antara frekuensi dan panjang gelombang (sama aja dgn bilangan gelombang)
d_kelik: Frekuensi kecil : gelombang panjang. Jd lebih cepat propagasinya. Frekuensi tinggi:panjang gelombangnya kecil. Jd lebih lambat velocity nya
meilalala: nah kalo gelombang dispersif apa?
d_kelik: Ya itu, yg di atas
meilalala: itu kan sipat dispersifnya
meilalala: kalo gelombang dispersif apa?
meilalala: OH aku inget....
Sifat Dispersif Gelombang: kecepatan gelombang dipengaruhi oleh panjang gelombangnya atau dengan katalain, kondisi dimana parameter gelombang (frekwensi/kecepatan) dipengaruhi oleh kondisi parameter gelombang lainnya. misalnya kecepatan gelombang dipengaruhi oleh panjang gelombang,
Gelombang dispersif adalah gelombang yang kecepatannya masih dipengaruhi oleh panjang gelombangnya..
Gelombang nondispersif adalah kondisi dimana parameter gelombang sudah tetap, artinya kecepatannya tidak lagi dipengaruhi oleh panjang gelombangnya
kira-kira seperti itu ;)
Subscribe to:
Posts (Atom)